Portfolio, October 2, 2015
S&P 500: 1951.36 (up 36.7%)
Portfolio: $818,503 ( up 70.8%)
FSHCX 2788 shares $237,816
ITB 8156.5 shares $216,881
XLP $363,806 (buying)
IBB 1153 shares $363,806 (selling)
Rebalanced:
FSHCX 3198.5 shares $272,834
ITB 10,261 shares $272,834
XLP 5703 shares $272,835
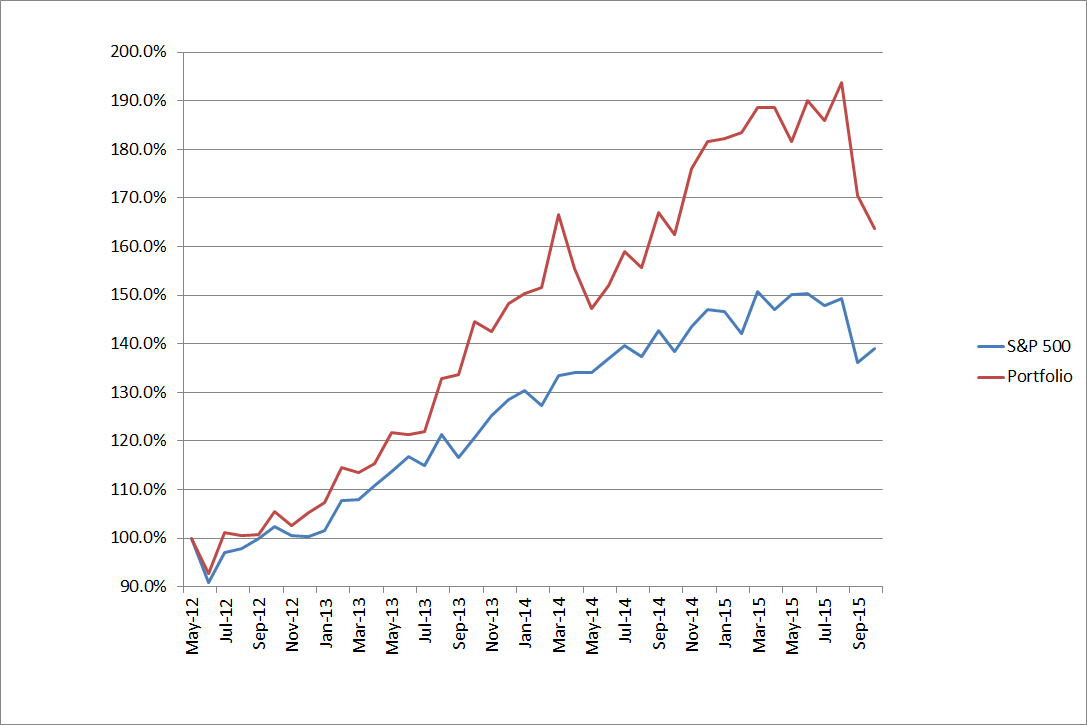
Notes: The portfolio underperformed the S&P 500 for the month, as investors fled riskier assets for utilities, consumer staples, and the like. The portfolio sold its longstanding share in biotech, replacing it with XLP – a leading consumer staples ETF. It also rebalanced after selling its largest holding, as reflected in the lower listing of holdings.
Portfolio, September 4, 2015
S&P 500: 1921.22 (up 36.7%)
Portfolio: $854,079 ( up 70.8%)
IBB 1153 shares $388,676
FSHCX 2788 shares $240,855
ITB 8156.5 shares $224,548 (buying)
PGJ 8989.13 shares $224,548 (selling)
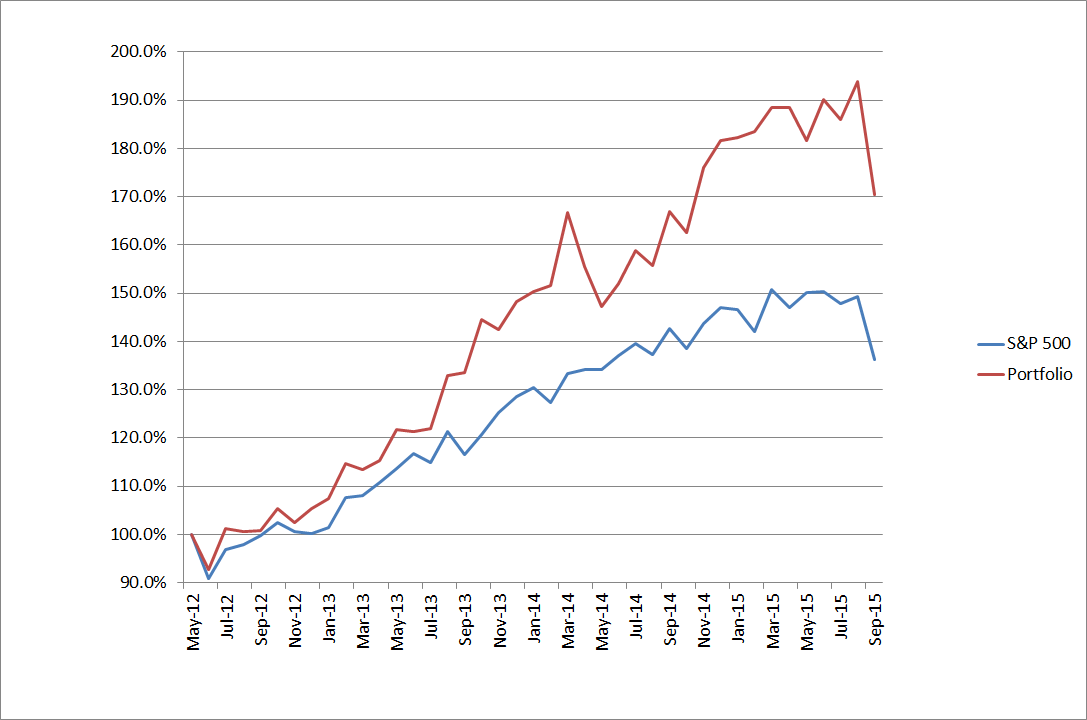
Notes: The portfolio is selling PGJ (China) in favor of ITB (housing), as China struggles to manage a stock market pretending to be open and transparent. The August downturn hit high fliers such as biotech and China particularly hard, but out-performance of the S&P 500 continues, by about 93% since May 2013.
Portfolio, August 5, 2015
No changes this month, as the portfolio continues to hold IBB, PGJ, and FSHCX. A quick review of mutual fund performance through the end of July shows that PGJ has underperformed, while indicating that other sectors such as consumer discretionary are showing momentum.
But, looking at consumer discretionary ETFs such as XLY shows that a recent decline in traditional media is likely to hit XLY hard as earnings announcements are made over the next several days, while PGJ continues to trade at relative lows. Further, PGJ includes only Chinese equities trading on non-Chinese exchanges, so liquidity concerns that plague Chinese stocks after recent changes in trading regulations should affect PGJ less than most Chinese ETFs and funds.
So, despite the numbers, no changes are being made this month.
Portfolio, July 7, 2015
S&P 500: 2081.34 (up 48.1%)
Portfolio: $948,903 ( up 89.8%)
IBB 1153 shares $429,331
FSMEX 6431.65 shares $244,917 (selling)
FSELX 3174.34 shares $274,655 (selling)
PGJ 8989.13 shares $259,786 (buying)
FSHCX 2788 shares $259,786 (buying)
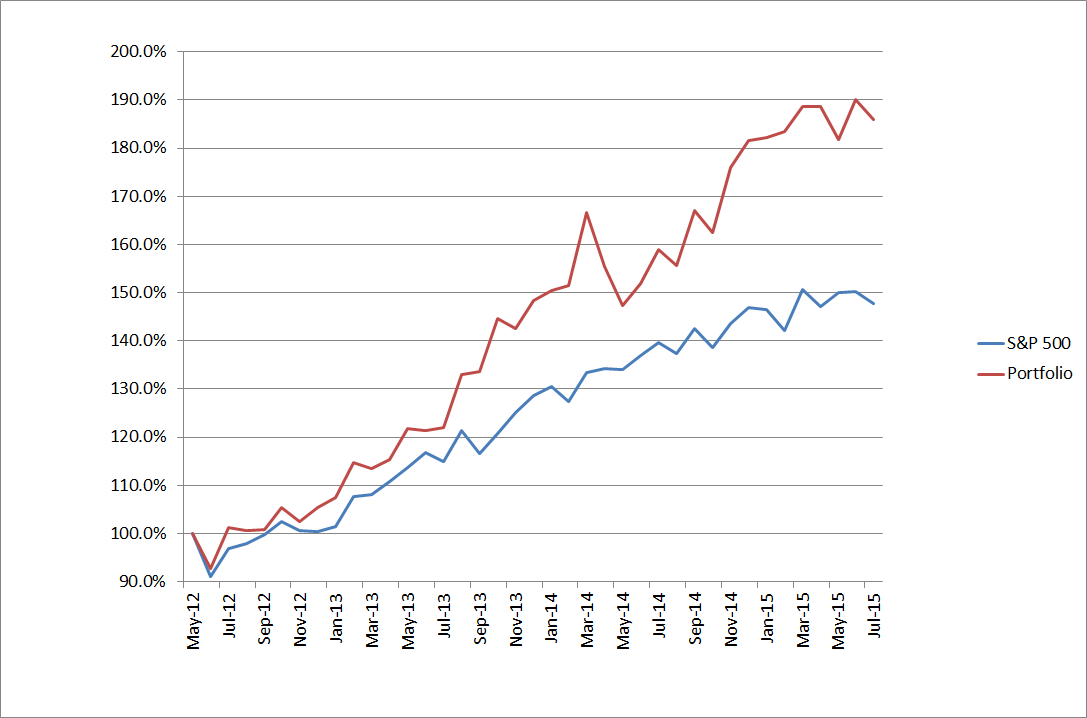
Notes: The portfolio is selling FSMEX and FSELX, medical device and electronics mutual funds, and moving into PGJ and FSHCX, China and medical delivery funds. Out-performance of the S&P 500 continues, by about 80% since May 2013.
Portfolio, April 2, 2015
S&P 500: 20677 (up 47.1%)
Portfolio: $942,867 ( up 88.6%)
IBB 1153 shares $391,67
VHT 2025 shares $271,593 (selling)
IYR 3502 shares $279,600 (selling)
FSMEX 6431.65 shares $275,596 (buying)
FSELX 3174.34 shares $275,596 (buying)
Notes: The portfolio is selling IYR and VHT, real estate and health care ETFs, and moving into FSMEX and FSELX, medical device and electronics mutual funds. Out-performance of the S&P 500 continues, albeit with somewhat higher volatility than the reference index.
Portfolio, February 2, 2015
S&P 500: 1996.7 (up 42.1%)
Portfolio: $917,176 ( up 83.4%)
IBB 1153 shares $373,168
VHT 2025 shares $259,463
IYT 1832.23 shares $284,545 (selling)
IYR 3502 shares $284,545 (buying)
Notes: The portfolio is selling IYT, which is underperforming and is less promising in the face of increasing gas prices, and moving to IYR, a real estate ETF. IDU (utilities) was also considered, but their recent run already anticipates long-term growth, and bottoming oil prices directed attention elsewhere.
Portfolio, December 1, 2014
S&P 500: 2065 (up 47.6%)
Portfolio: $908,258 ( up 81.7%)
IBB 1153 shares $348,955
VHT 2025 shares $257,297
IYT 1832.23 shares $300,358
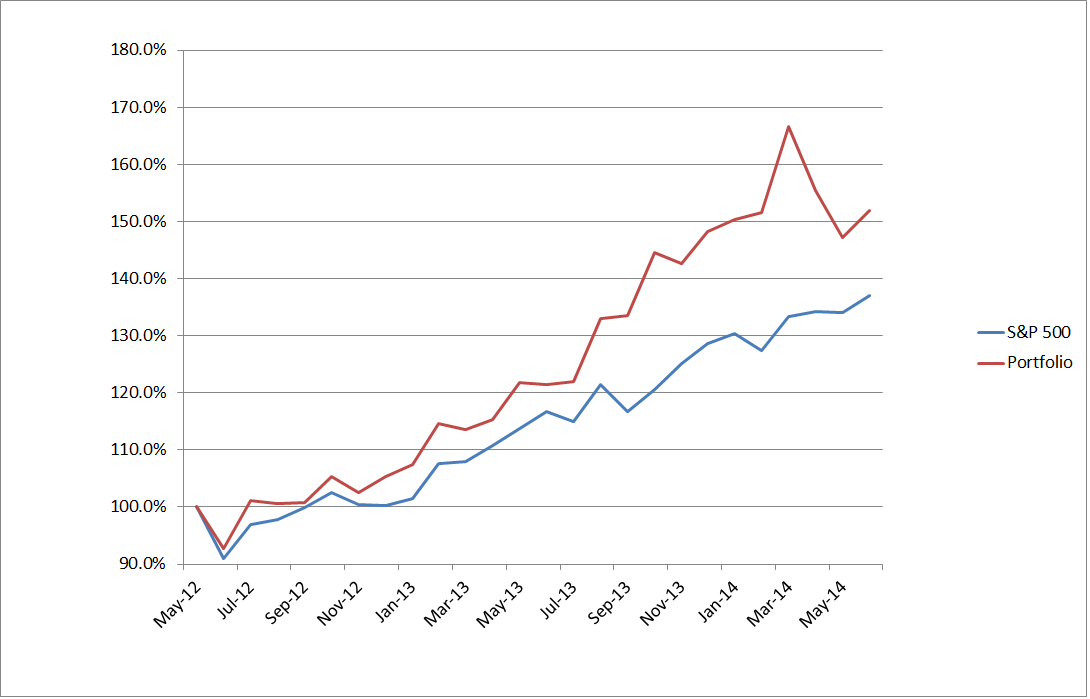
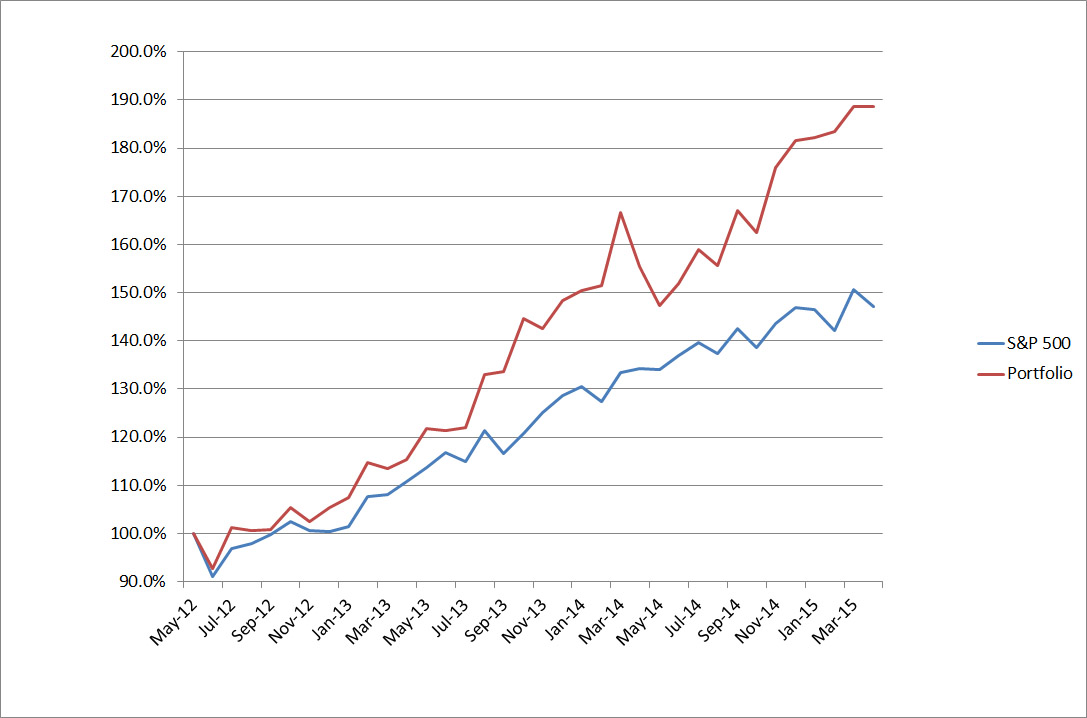
Notes: The portfolio has not made any changes for several months now, and has outperformed the S&P 500 by approximately 72% since May of 2012. All three sectors showed similar gains for November, and a review of mutual fund and ETF performance over the past year shows no compelling replacements.
As the graph below now approaches three years of relative performance of the portfolio v. the S&P 500, it becomes evident that a momentum-based portfolio can outperform the S&P 500, but will likely occasionally have volatility that significantly exceeds the index (e.g. March/April 2014). The performance of the model portfolio neverthelss makes a momentum strategy such as the one tracked here desirable for long-term investors, when greater short-term volatility can be overcome by an overall trend of outperformance.

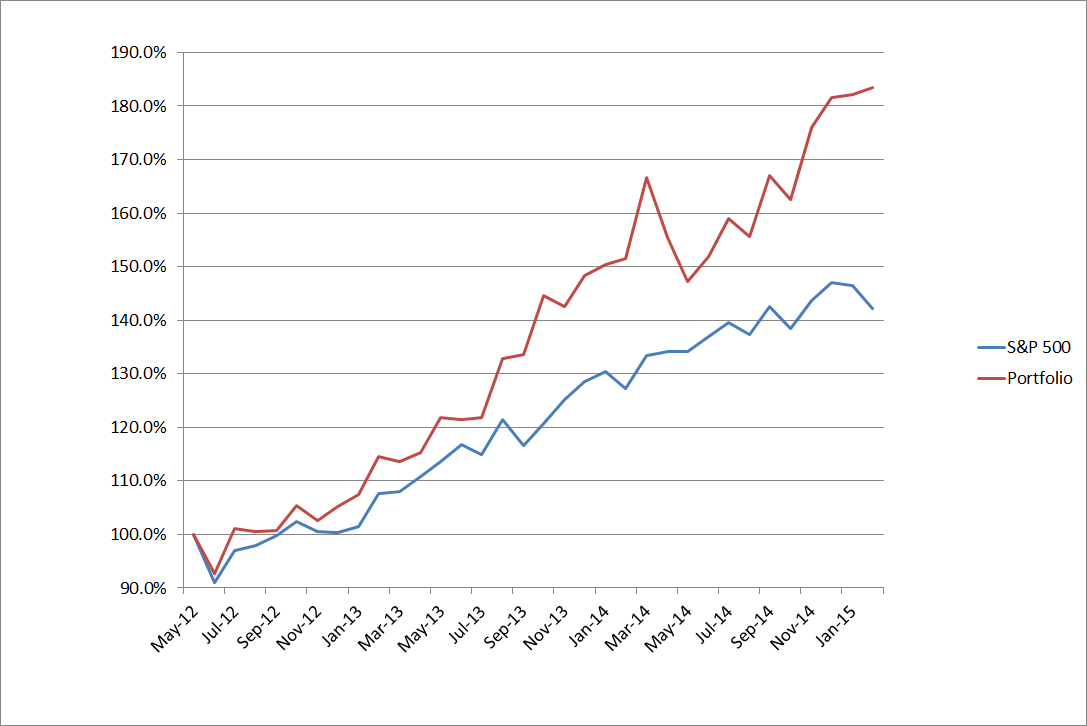
Portfolio, November 3, 2014
S&P 500: 2018 (143.6%)
Portfolio: $880,062 (176.0%)
IBB 1153 shares $341,645
VHT 2025 shares $250,776
IYT 1832.23 shares $287,641
Notes: The portfolio has not made any changes for several months now, and has outperformed the S&P 500 by approximately 77%. A downturn at the end of September through mid-October caused a decline in the portfolio in line with the resulting drop in the S&P 500, but the recovery from mid-October lows favored the funds held in the portfolio. Biotech and health care continue to perform strongly, while transportation continues to do well enough to avoid replacement.
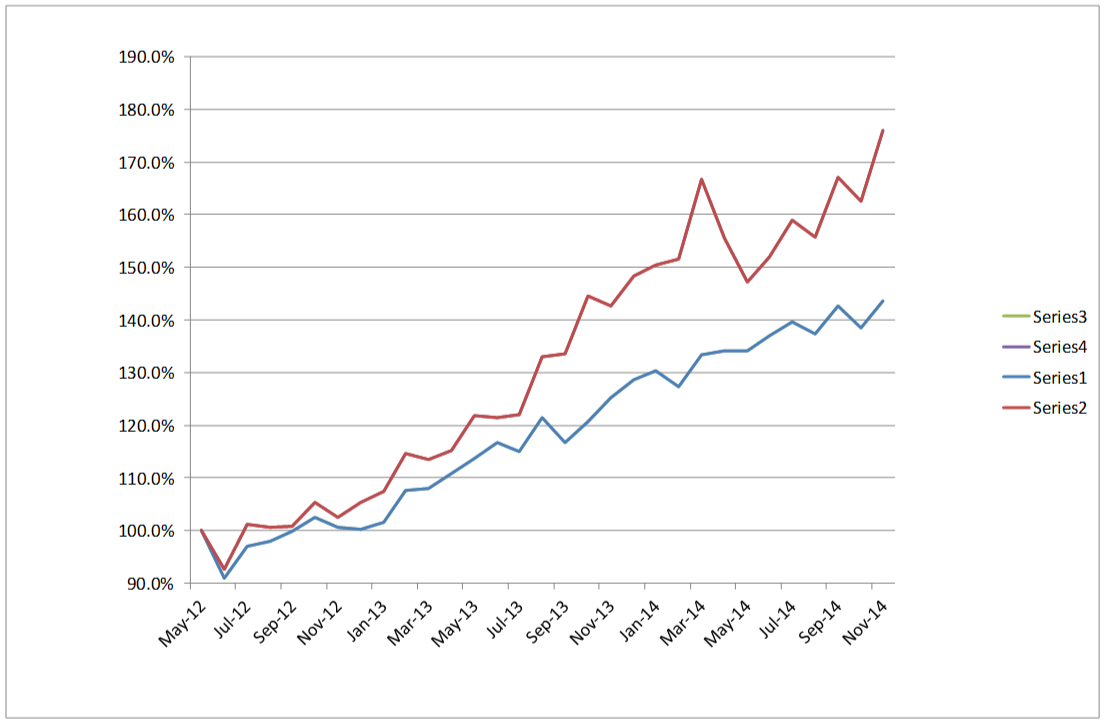
Portfolio, September 2, 2014
S&P 500: 2004 (142.6%)
Portfolio: $834,983 (167.0%)
IBB 1153 shares $320,557
VHT 2025 shares $237,998
IYT 1832.23 shares $276,428
Notes: The portfolio has not made any changes the past few months, and has outperformed the S&P 500 by approximately 57%. Despite higher volatility this year, the portfolio has remained soundly above the index benchmark. Biotech and health care continue to perform strongly, while transportation does well enough to avoid replacement
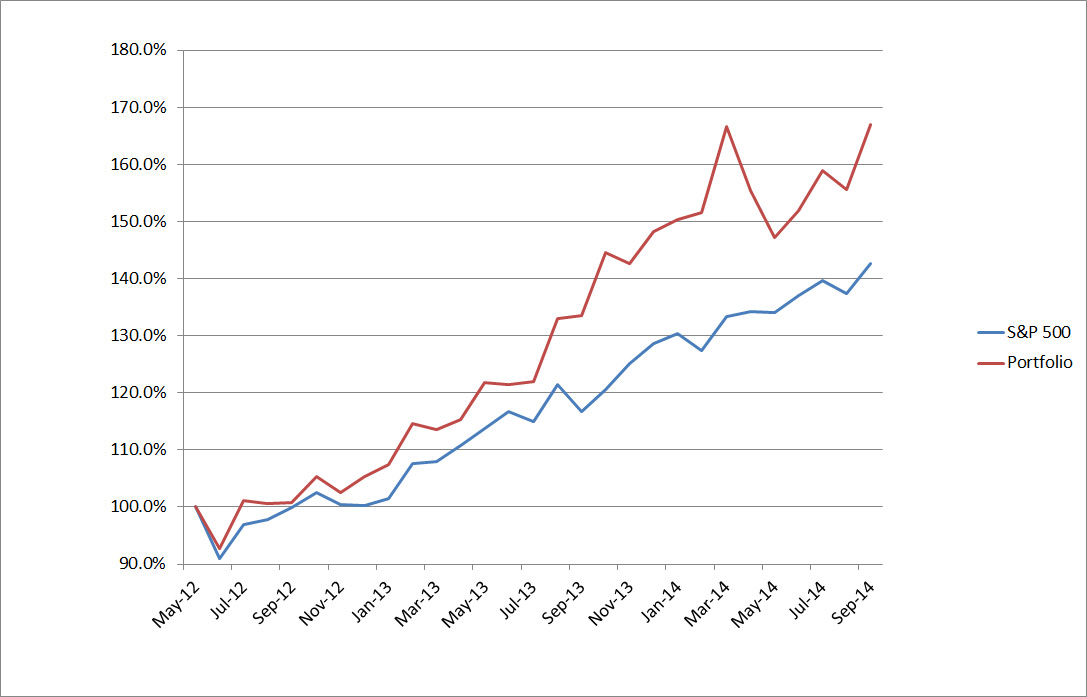
Portfolio, March 4, 2014
S&P 500: 1925 (137%)
Portfolio: $759,810 (152%)
The portfolio still holds IBB, VHT, and VDE as of June 2, but will be swapping VDE (energy) out and replacing it with IYT (transportation). The portfolio suffered a serious setback, as IBB (biotech) collapsed in March and April. It has recovered well since then, although not to March’s highs. Despite this setback, the portfolio has returned over 40% more than the S&P 500 since May 1, 2012: